
Your Investing Toolkit: Where to Find Reliable Stock Market Information
Your phone lights up. A share on your watchlist is rising, and a message in a group says the company has announced “excellent earnings.”
You open a website. Then another. One shows the price, another displays financial ratios, and a third offers a chart full of indicators. Ten minutes later, you have more tabs open—but you are still unsure what the announcement actually means.
For a new investor, this is a familiar kind of confusion. Information is easy to find. Knowing where to look, what to trust and how to use it takes practice.
In the previous Beginner’s Guide, we explored four foundations: fundamentals, technical analysis, behaviour and money management. Now let’s give those ideas a practical toolkit. Different websites and apps do different jobs well. Once you understand those jobs, research becomes easier to organise.
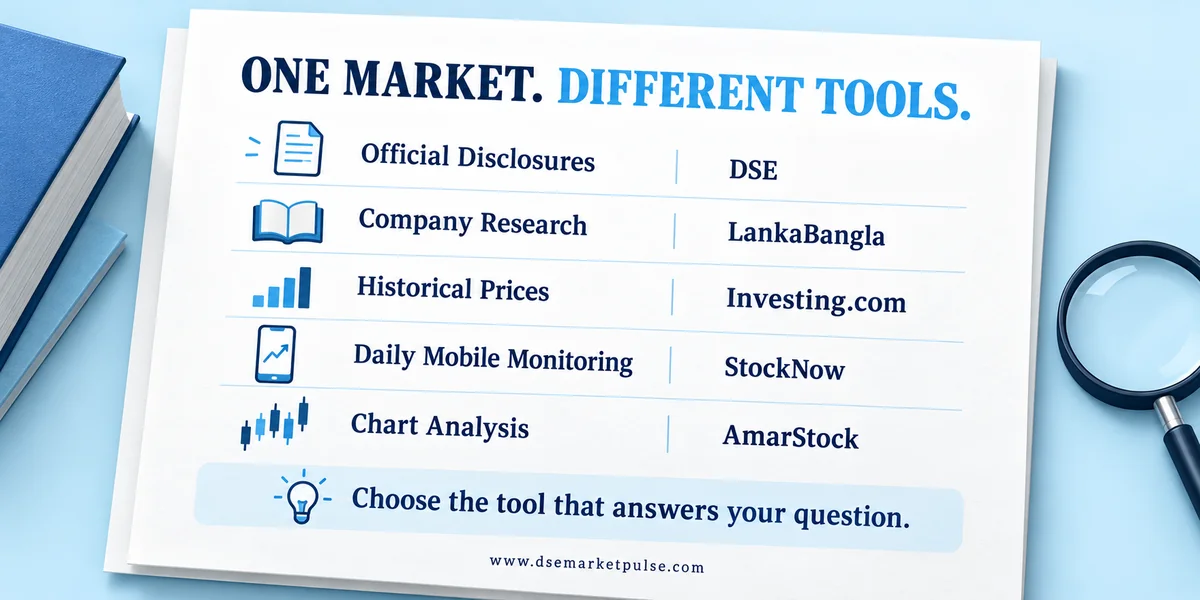
Start with DSE: What Has Actually Been Announced?
Before deciding whether the earnings are “excellent,” find the announcement itself.
The Dhaka Stock Exchange Website is the starting point for official exchange information. Market data, company information, and announcements help you check what has been disclosed instead of relying on somebody else’s interpretation.
Open the relevant company announcement and read the date, reporting period, and wording. Are the earnings for one quarter or a cumulative period? Is the dividend proposed or approved? A short social-media post can leave out precisely the detail that changes your understanding.
DSE also provides a broad view of the market. It helps you place one share’s movement beside the wider index, turnover and other listed companies.
For research, however, viewing information and organising it into your own worksheet are different tasks. A public page may not provide the bulk-download format, date range or convenient export you need. Check the available tools on the relevant page rather than assuming that everything visible can be extracted in one step.
Think of DSE as your reference desk: the place to begin verification, even when you use other tools to explore the information further.
Use LankaBangla to Put Company Information in Context
Now you know what was announced. The next question is more useful: how does it compare with the company’s earlier performance?
The LankaBangla Financial Portal brings together company and market information in a convenient research environment. Its market views, company data, and Price Archive can help you move beyond a single headline and examine the surrounding picture.
For a beginner, the value lies in building connections. An earnings figure means more when you consider the reporting period, earlier results, valuation, and the business behind it.
If you want to build your own spreadsheet, check how the particular view handles copying or exporting. Moving data into a worksheet may not be straightforward in every section. That is a practical access issue to check, not a reason to dismiss the portal’s usefulness for on-screen research.
Use the summary to discover what deserves closer attention. Then return to the company’s financial statements when you need the definitions, notes, and detail behind a number.
Use Investing.com When Your Question Needs Price History
The share has risen today. But what happened over the past few months—or during earlier reporting periods?
Investing.com is useful for exploring available historical price data. It has a DSEX Historical-Data Page and pages for individual Bangladesh-listed shares, such as BRAC Bank. These provide a place to examine prices across a selected period and, where the site makes it available, use its permitted download tools for your own analysis.
Start by confirming the instrument. DSEX and DS30 are different indices, and a company’s trading symbol can differ across websites. Then check the available date range, frequency, and fields. A chart’s visible history does not necessarily mean the same history is available in a downloadable table. Access can also depend on the page or account.
Before calculating returns, check the price basis and corporate actions. An unadjusted price move around a share adjustment may tell a different story from an adjusted series. A price return also does not automatically include cash dividends.
Keep the source, download date, and assumptions beside your worksheet. In the future, you will appreciate knowing where those numbers came from.
Keep StockNow for the Daily Watchlist
You cannot sit beside a laptop all day. Sometimes you simply want to know how the market and your watchlist are moving.
StockNow offers a mobile-friendly way to monitor the Bangladesh market. Its Official Android listing describes stock-price monitoring, favourite lists, alarms, screening, and other research features.
For a beginner, a short watchlist is a sensible starting point. Follow a few companies you are learning about and observe how their prices and trading activity change. Check the update time rather than assuming every screen is instantaneous.
Return to our opening example. The app has drawn your attention to a moving share. That is useful—but it has only started the question. The reason for a decision still needs to come from your research.
An alert can bring a company back to your attention. It should not become an instruction to buy it.
Explore AmarStock When You Want to Study the Chart
After verifying the announcement and reviewing the business, you may want to examine the share’s price behaviour more closely.
AmarStock provides charting and market-analysis tools for Bangladesh’s market. It confirms a TradingView Partnership for its Chart Capabilities, while its Interactive Chart offers settings including adjusted and unadjusted data.
This makes it a useful place to practise technical analysis. Start with the price trend, time frame, and volume. Add a drawing tool or indicator only when you understand the question it helps answer.
AmarStock lists both free and premium services. Advanced features and access depend on its current offering, so check the membership details before paying for a particular tool. A TradingView-based chart on another platform should not be assumed to include every feature of a separate TradingView plan.
A beginner does not need a screen covered with indicators. A clean chart, a clear time frame, and a written observation are enough to begin learning.
Add a Few Official Bookmarks Behind the Main Toolkit
These five tools cover much of the everyday workflow. A few additional bookmarks help when your question goes deeper.
The company’s own investor-relations or financial-reports section is where you should look for the full annual report, financial statements, and explanatory notes. A summary ratio can point you towards a question; the report helps you investigate it.
BSEC provides investor-education material and is an official reference for securities-market regulation. Bangladesh Bank’s economic-data section is useful when you want to understand the wider setting, including interest rates and exchange rates. For your own securities holdings, CDBL’s BO Balance-Inquiry Service provides a separate account-checking resource, subject to registration and its service terms.
You do not need to open every source every day. Bookmark them so that you know where to go when a specific question appears.
When Two Websites Show Different Numbers
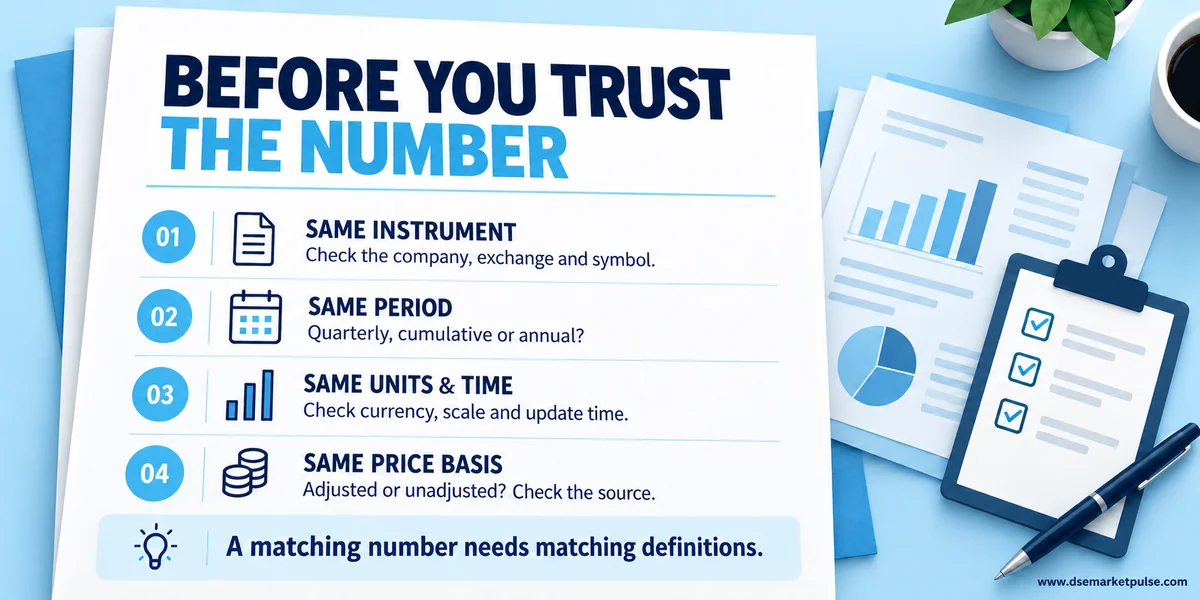
Sooner or later, you will find an EPS, ratio, or price that appears different on two screens. Avoid choosing whichever figure supports the investment idea you already like.
First, check whether you are comparing the same company, period, and definition. One EPS figure may cover a quarter and another nine months. A valuation ratio may use a different earnings period. One price may be an intraday value and another a closing price. Currency, scale, and corporate-action adjustments can also create differences.
Go back to the original disclosure for company facts and check the provider’s explanation for calculated data. If you cannot reconcile the difference, note the uncertainty before using the number.
Build One Small Research Routine
Return to that notification on your phone. This time, follow it with a sequence you can repeat.
Use your watchlist to notice the movement. Open DSE to verify the announcement. Read the company’s report and use LankaBangla to organise the wider picture. If the question needs price history, explore Investing.com. If it needs a closer chart study, open AmarStock.
Then close the extra tabs and write a few lines in your own words: what happened, what it could mean, what remains unclear, and whether it deserves further attention.
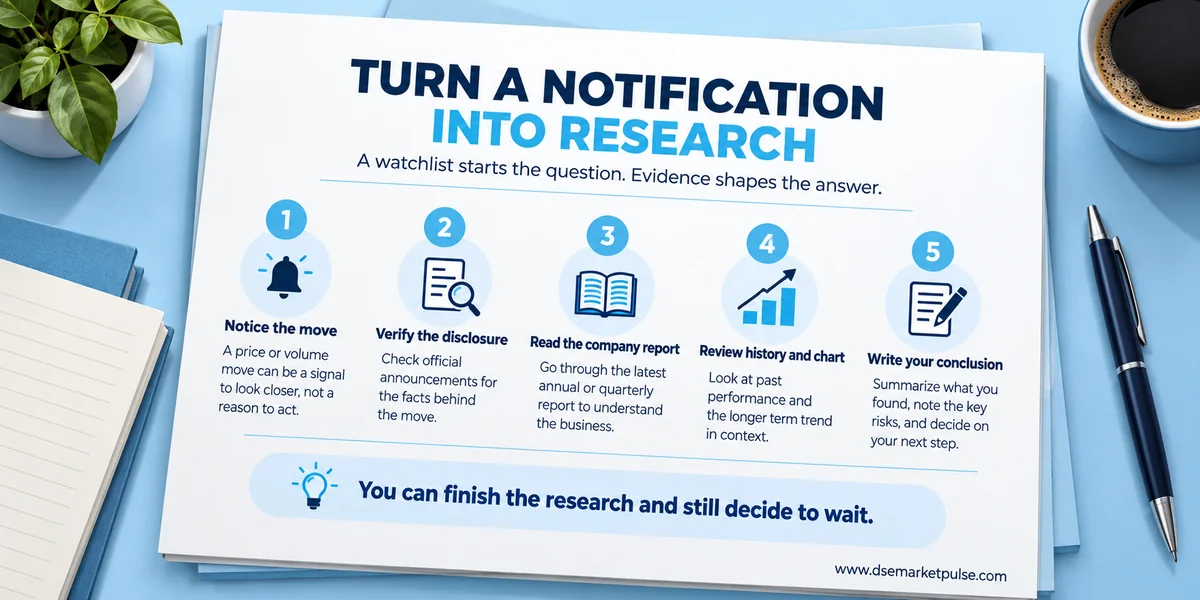
For your first exercise, choose one company you want to understand. Find its latest financial disclosure, locate the underlying report, inspect an available price history, and describe its chart without making a prediction. Record the links and dates in a simple research note.
You may finish without buying anything. You have still made progress: you now understand more than the headline that first caught your attention.
That is how a useful investing toolkit develops—one question, one reliable source and one clearer decision at a time.
Next in the Beginner’s Guide: Who can invest in Bangladesh’s stock market? We will look at investor eligibility and the practical requirements to get started.
Platform features and access were checked against publicly available provider pages on 1 November 2026. Menus, subscriptions, data coverage and download options can change. Use permitted export tools and review the provider’s terms before reusing data. This guide is educational and does not rank platforms by investment performance.




Leave a comment
Please login to leave a comment or reply.